
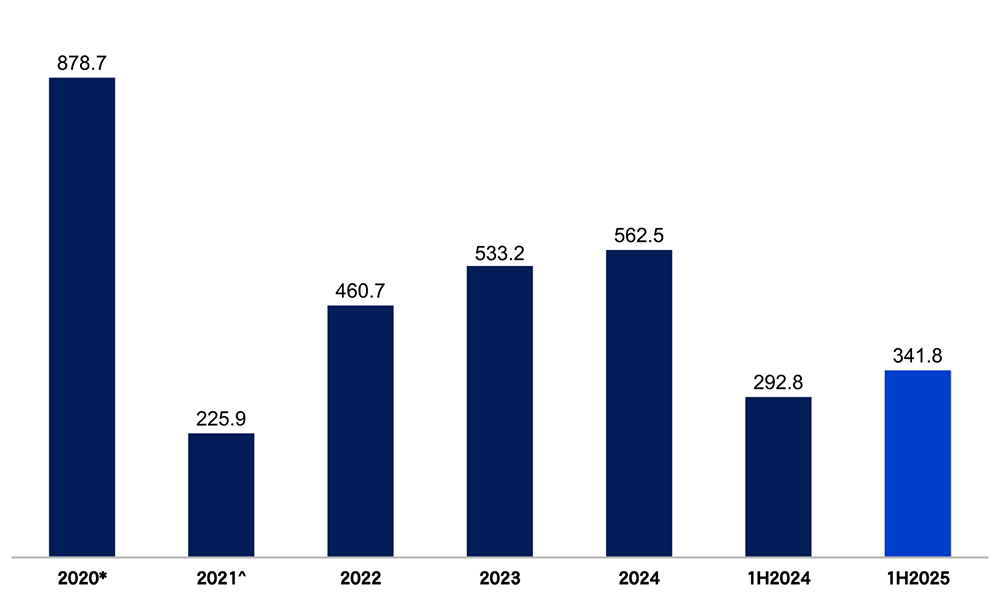
Revenue (US$ million)
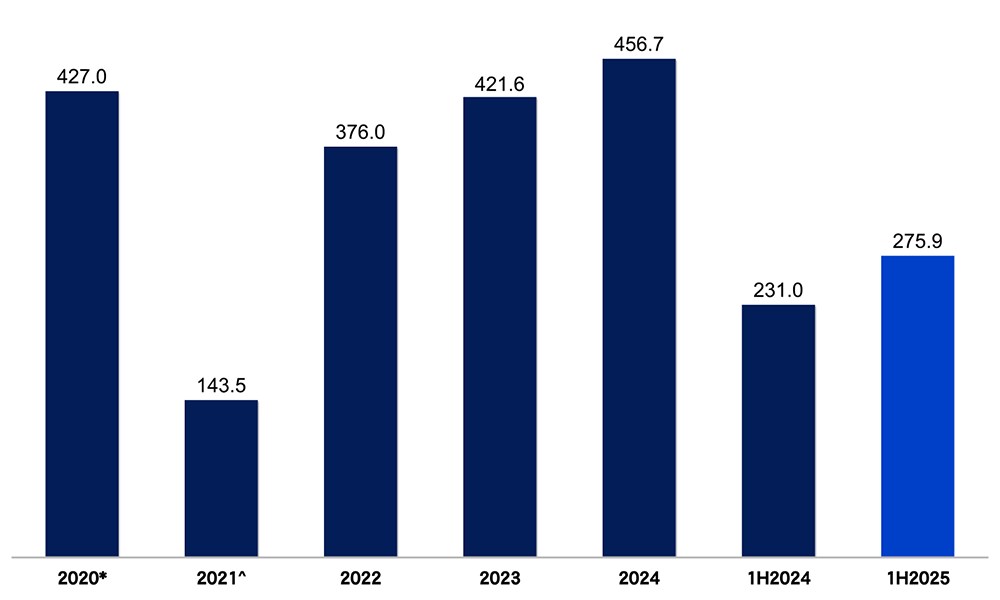
Gross Profit (US$ million)
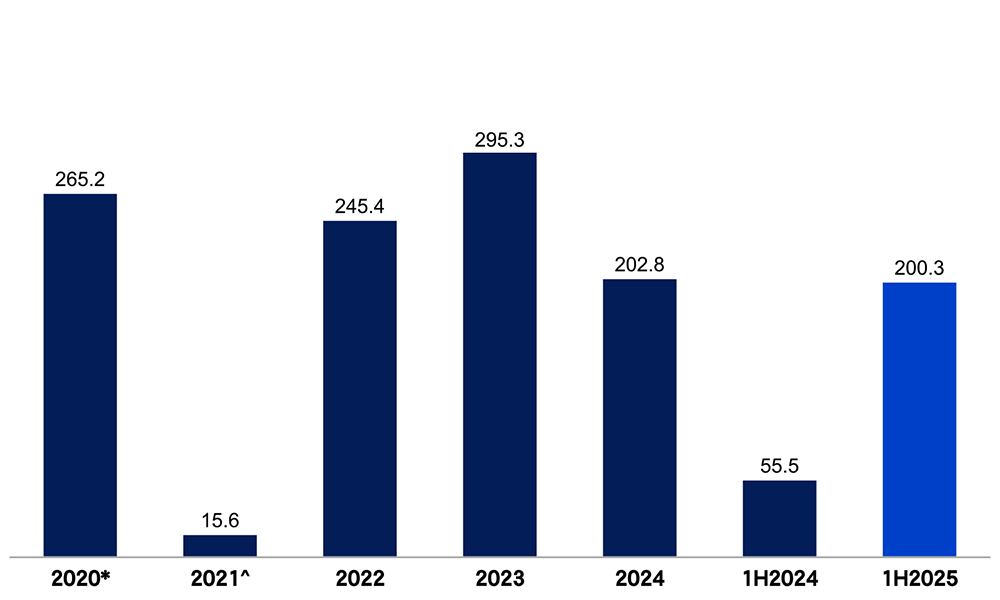
EBITDA (US$ million)
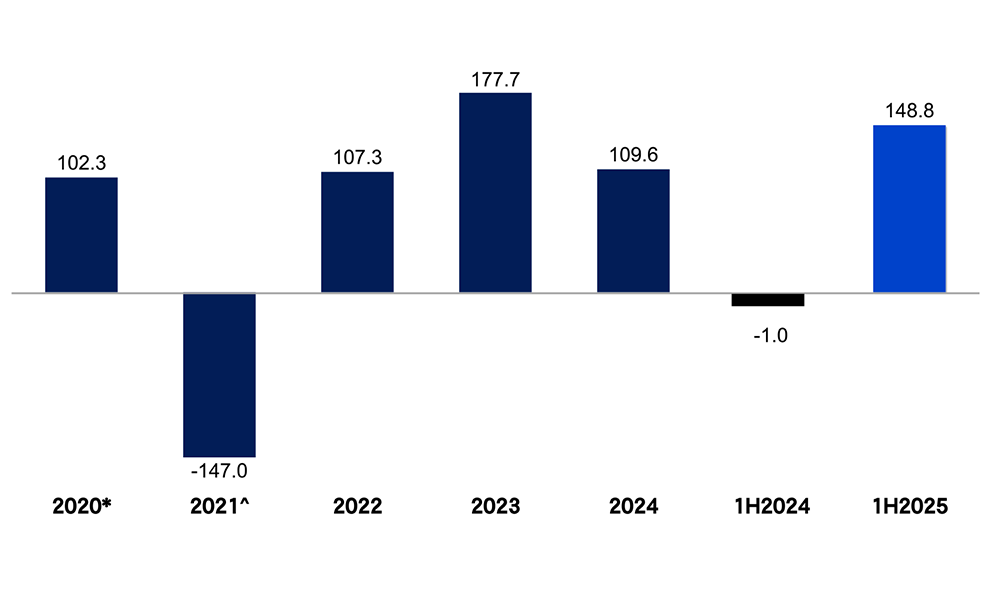
Net Profit/(Loss) (US$ million)
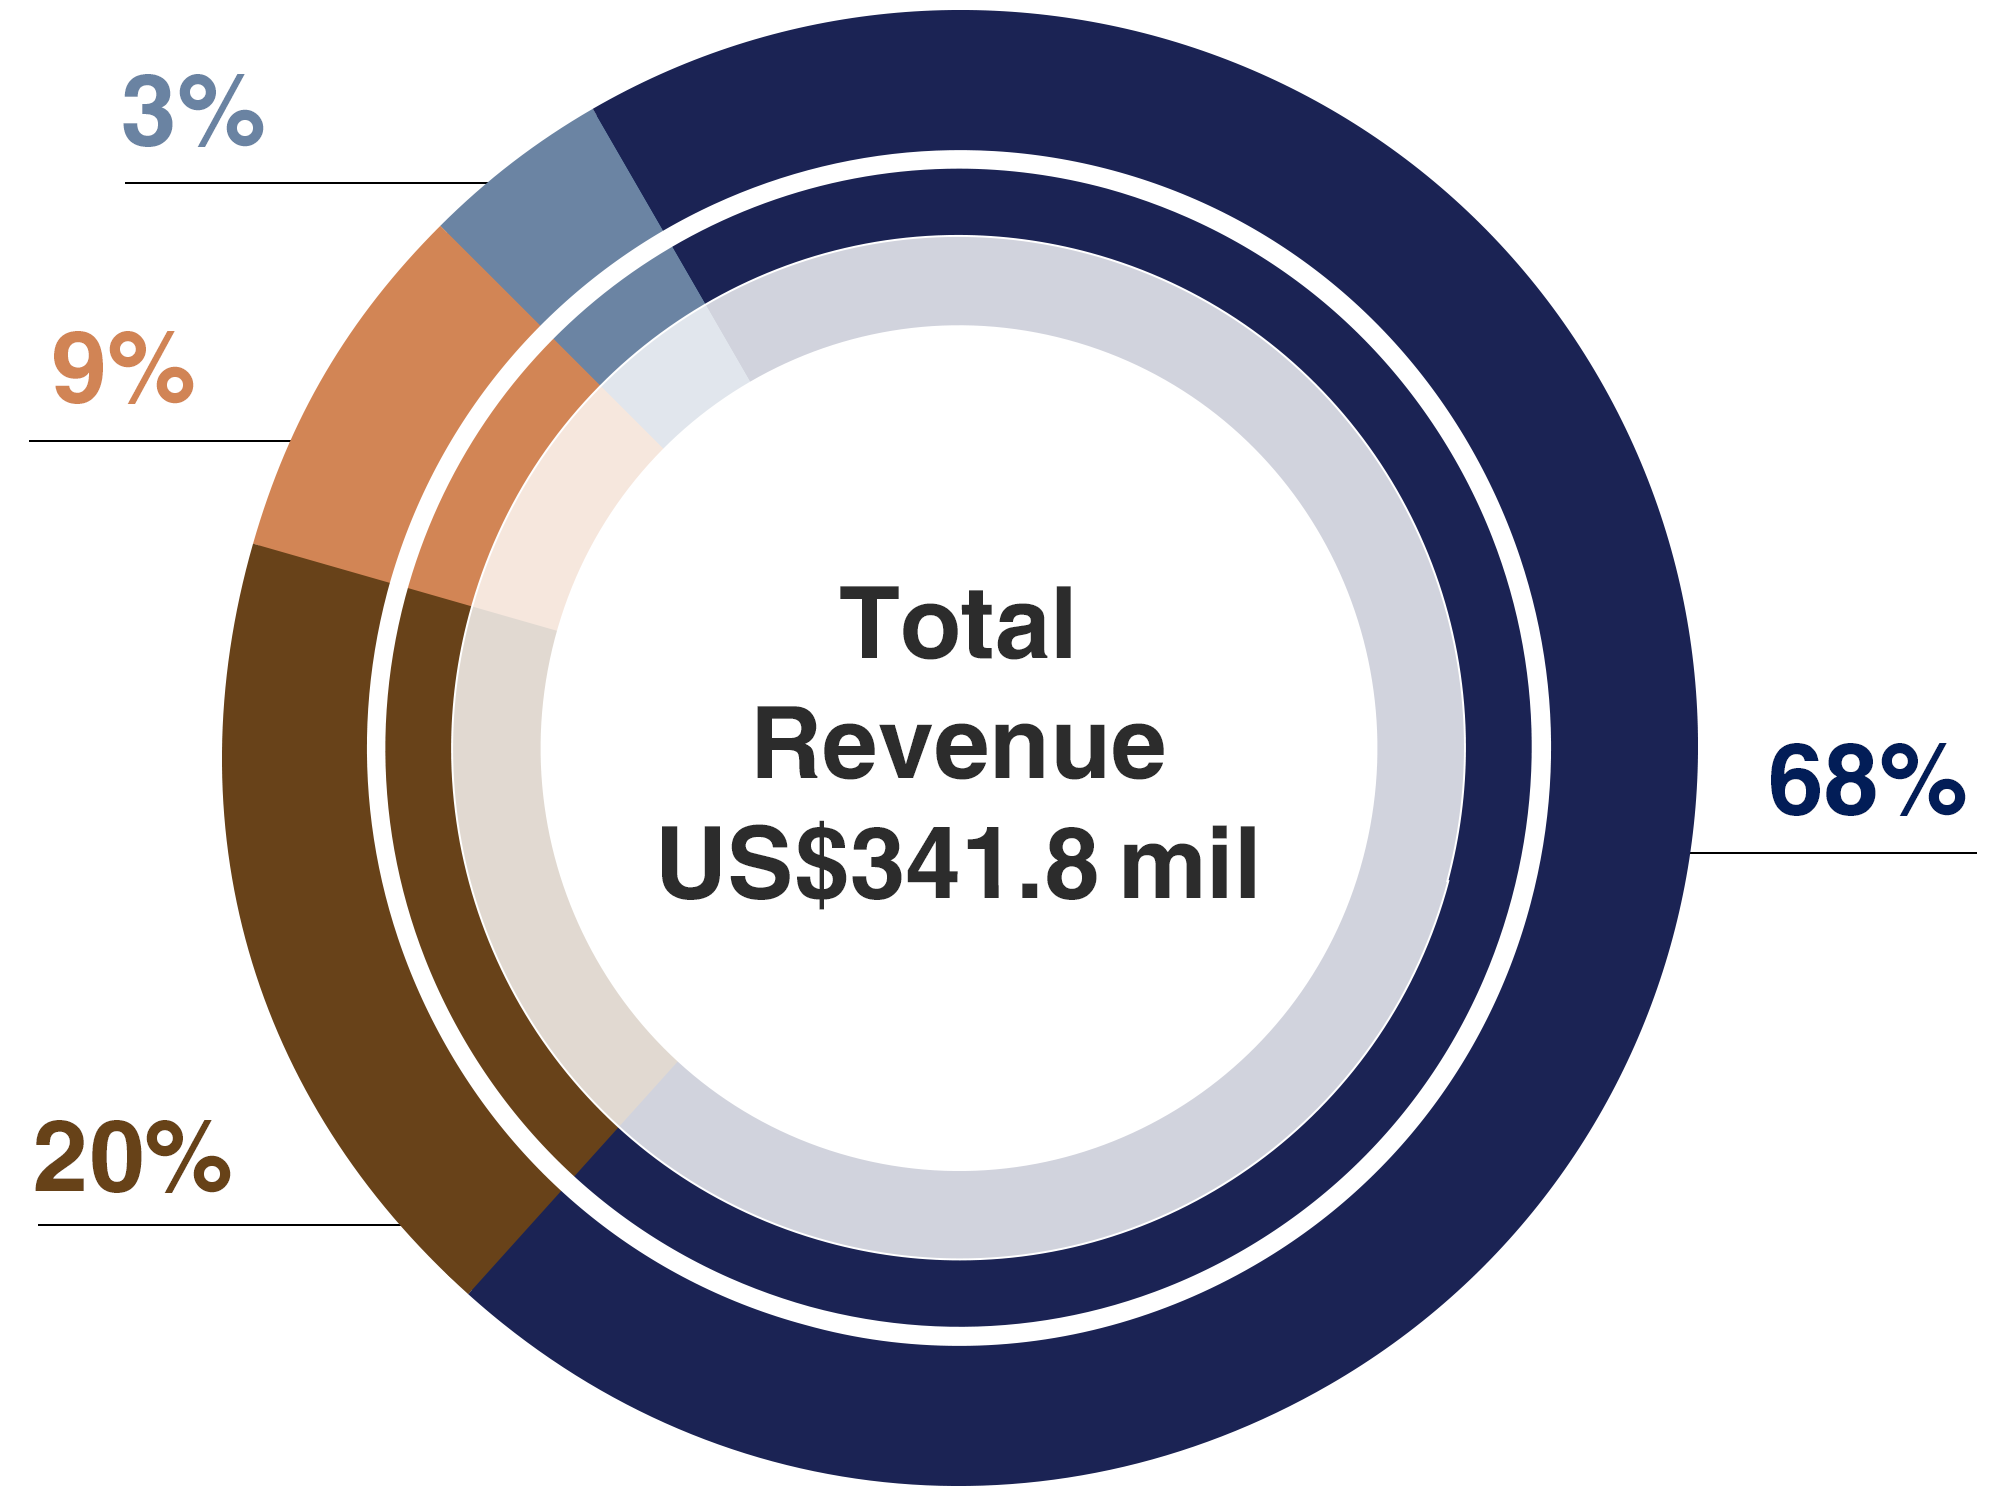
Revenue Composition
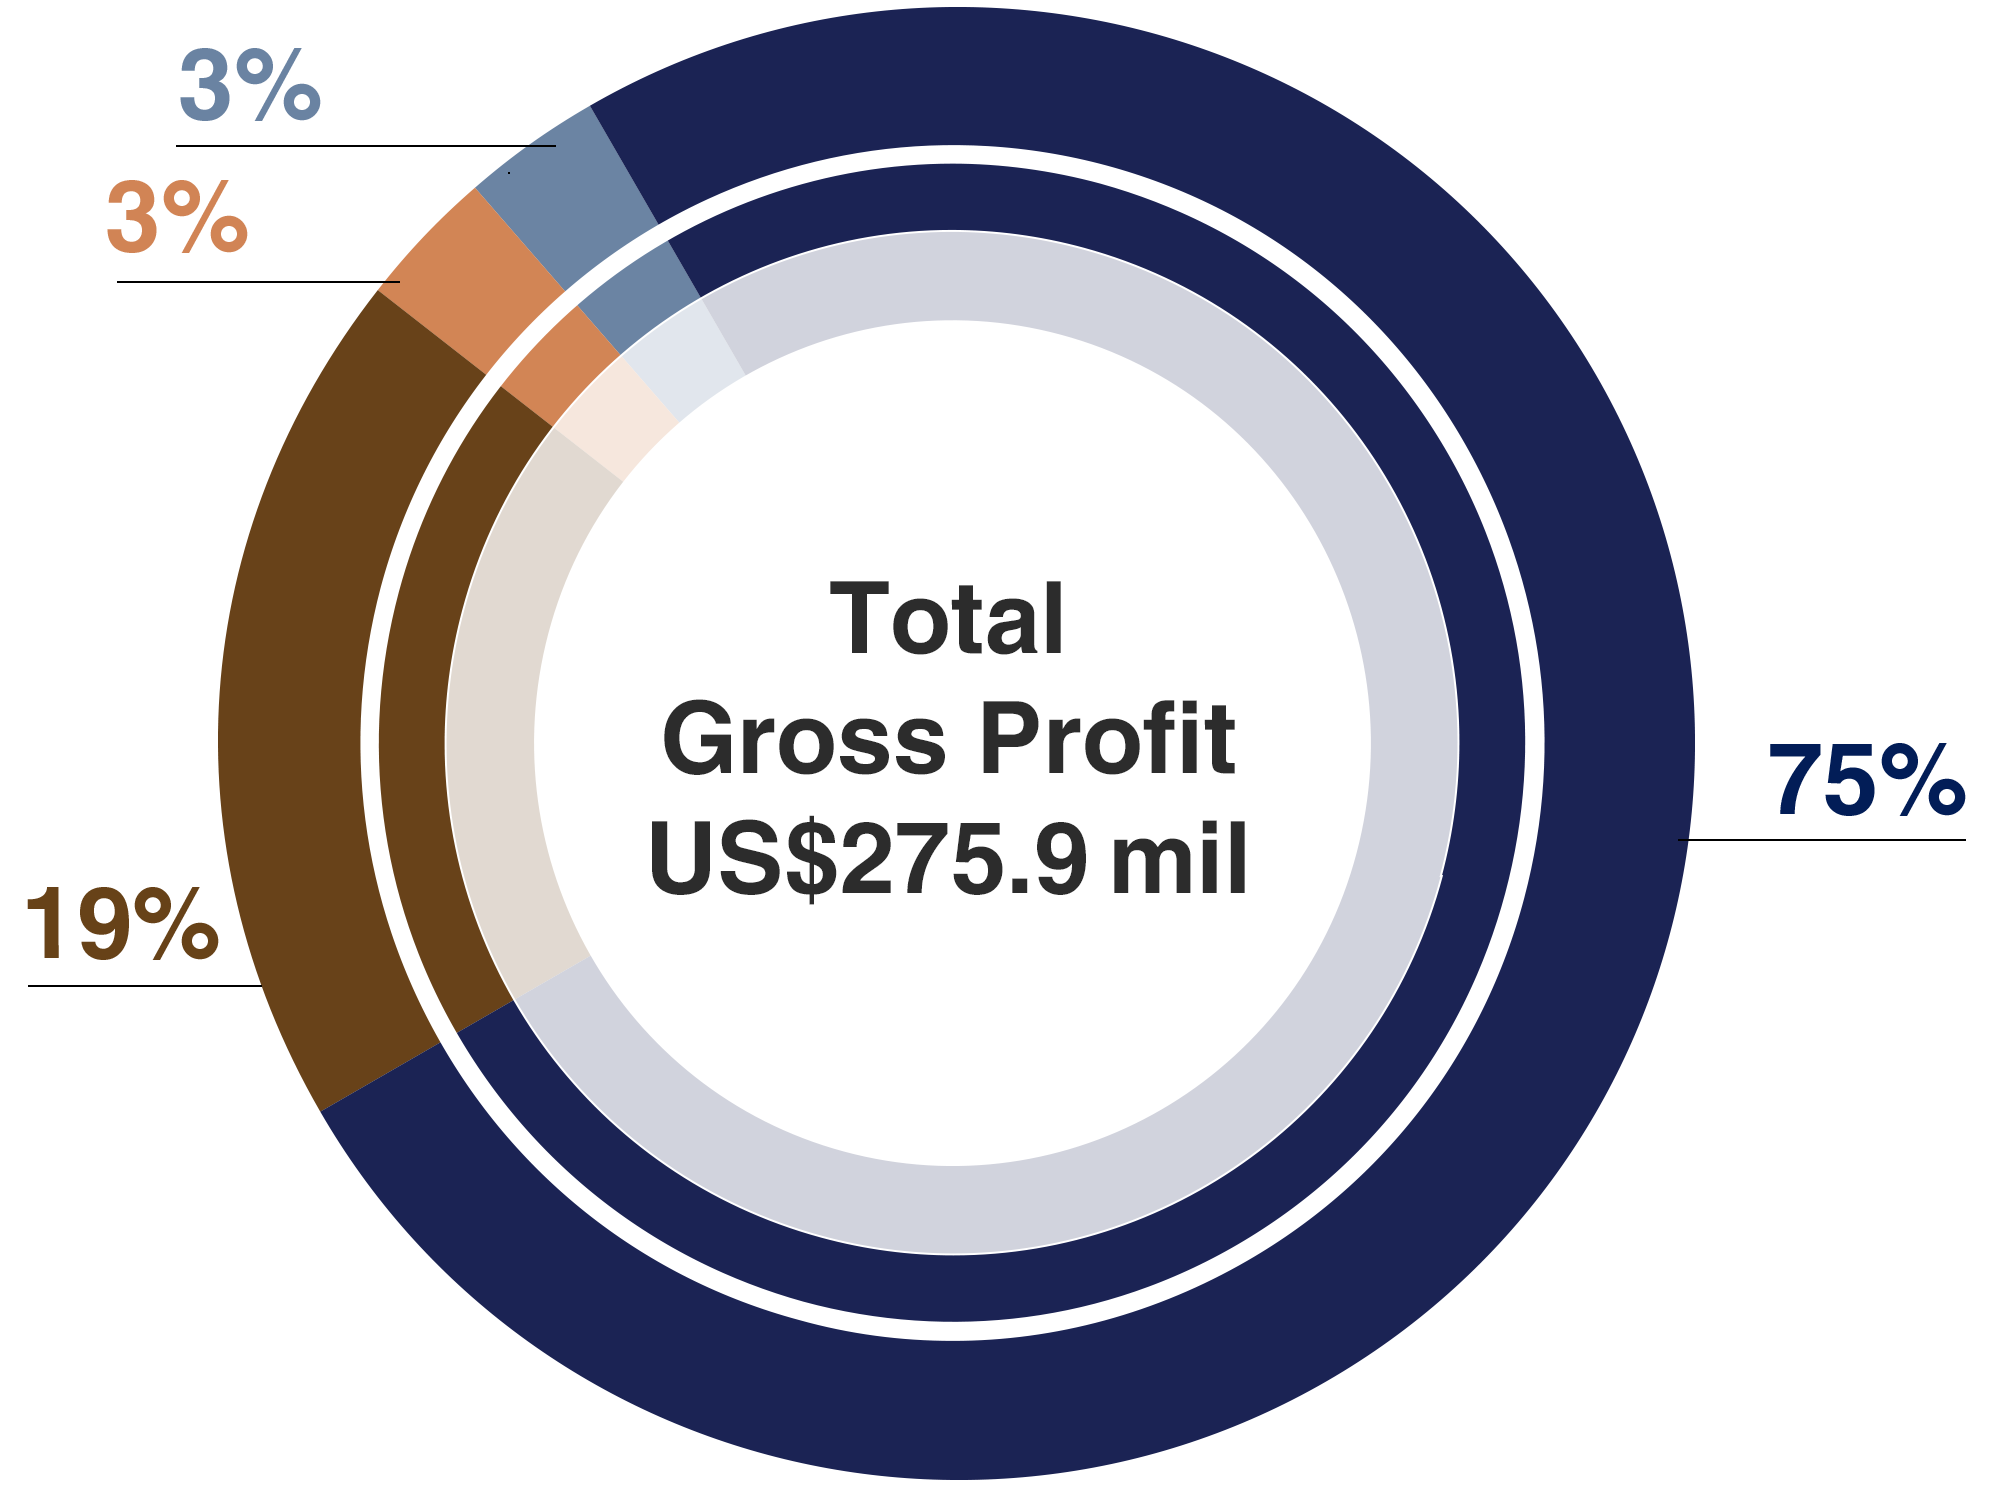
Gross Profit Composition

1H2025
- Gross Gaming Revenue of US$332.3 million
- EBITDA of US$200.3 million
- Basic earnings per share of US cents 3.36
Revenue and Gross Profit Analysis
| 1H2025 | Revenue | Gross Profit | Gross Profit Margin |
||
| US$ million | % | US$ million | % | % | |
|---|---|---|---|---|---|
| Mass Market | 232.1 | 68 | 206.8 | 75 | 89 |
| Premium VIP Market | 68.5 | 20 | 53.3 | 19 | 78 |
| Referral VIP Market | 31.7 | 9 | 7.8 | 3 | 25 |
| Non-Gaming | 9.5 | 3 | 8.0 | 3 | 84 |
| Total | 341.8 | 100 | 275.9 | 100 | 81 |
*9 months operations due to the mandatory suspension of gaming business between 2 April and 7 July to prevent the coronavirus from spreading.
^5.5 months of business operations due to the voluntary temporary suspension of business operations between 2 March and 14 September in response to the COVID-19 situation in Cambodia.