Source: The World Bank (http://data.worldbank.org/country/cambodia)
| Population (million) |
2009 | 2010 | 2011 | 2012 | 2013 | 2014 | 2015 | 2016 | 2017 | 2018 | 2019 |
| Cambodia | 13.7 | 13.9 | 14.1 | 14.4 | 14.6 | 14.8 | 15.1 | 15.3 | 15.6 | 15.8 | 16.1 |
| Vietnam | 87.1 | 88.0 | 87.9 | 88.8 | 89.8 | 90.7 | 91.7 | 92.7 | 93.7 | 94.7 | 96.5 |
| Thailand | 66.9 | 67.2 | 67.5 | 67.8 | 68.1 | 68.4 | 68.7 | 69.0 | 69.2 | 69.4 | 69.6 |
| Myanmar | 49.5 | 49.8 | 50.2 | 50.6 | 51.0 | 51.4 | 51.8 | 52.3 | 52.6 | 53.0 | 53.4 |
| Laos | 6.2 | 6.3 | 6.4 | 6.5 | 6.6 | 6.7 | 6.8 | 6.9 | 7.0 | 7.1 | 7.2 |
| The Mekong Region | 223.3 | 225.2 | 226.1 | 228.1 | 230.1 | 232.1 | 234.1 | 236.1 | 238.1 | 240.0 | 242.8 |
| Population (million) |
2020 | 2021 | 2022 | 2023 | 2024 | 2025 | 2026 | 2027 | 2028 | 2029 | 2030 |
| Cambodia | 16.3 | 16.6 | 16.8 | 17.0 | 17.2 | 17.4 | 17.5 | 17.7 | 17.9 | 18.1 | 18.2 |
| Vietnam | 97.6 | 98.5 | 99.5 | 100.3 | 101.3 | 102.2 | 102.9 | 103.6 | 104.2 | 104.9 | 105.4 |
| Thailand | 69.8 | 70.0 | 70.1 | 70.2 | 70.3 | 70.3 | 70.4 | 70.4 | 70.4 | 70.4 | 70.4 |
| Myanmar | 53.7 | 54.1 | 54.4 | 54.7 | 54.9 | 55.2 | 55.4 | 55.6 | 55.8 | 56.0 | 56.2 |
| Laos | 7.3 | 7.4 | 7.5 | 7.6 | 7.7 | 7.8 | 7.9 | 8.0 | 8.1 | 8.2 | 8.3 |
| The Mekong Region | 244.8 | 246.5 | 248.2 | 249.7 | 251.4 | 252.8 | 254.1 | 255.3 | 256.4 | 257.5 | 258.5 |
Source: International Monetary Fund (IMF), October 2025
Note: Estimated 2025 – 2030
- The Mekong Region comprises Cambodia, Vietnam, Thailand, Myanmar and Laos. The region's population has been growing at a Compound Annual Growth Rate (CAGR) of 0.8% between 2009-2024. In 2024, the region had a total population of about 251.4 million.
- Cambodia's population has been one of the fastest growing regions overall, achieving a CAGR of 1.5% between 2009-2024. It recorded a population of 17.2 million in 2024.
| GDP per capita current prices (US$) |
2009 | 2010 | 2011 | 2012 | 2013 | 2014 | 2015 | 2016 | 2017 | 2018 | 2019 |
| Cambodia | 913 | 992 | 1,133 | 1,241 | 1,357 | 1,486 | 1,607 | 1,736 | 1,888 | 2,097 | 2,281 |
| Vietnam | 1,481 | 1,628 | 1,950 | 2,198 | 2,370 | 2,567 | 2,582 | 2,720 | 2,958 | 3,216 | 3,439 |
| Thailand | 4,213 | 5,076 | 5,492 | 5,861 | 6,168 | 5,952 | 5,840 | 5,993 | 6,594 | 7,299 | 7,813 |
| Myanmar | 620 | 760 | 1,061 | 1,155 | 1,229 | 1,272 | 1,144 | 1,203 | 1,255 | 1,273 | 1,410 |
| Laos | 1,032 | 1,187 | 1,397 | 1,566 | 1,814 | 1,983 | 2,124 | 2,308 | 2,437 | 2,552 | 2,603 |
| The Mekong Region | 2,061 | 2,413 | 2,744 | 2,978 | 3,162 | 3,192 | 3,144 | 3,264 | 3,553 | 3,874 | 4,146 |
| GDP per capita current prices (US$) |
2020 | 2021 | 2022 | 2023 | 2024 | 2025 | 2026 | 2027 | 2028 | 2029 | 2030 |
| Cambodia | 2,136 | 2,218 | 2,321 | 2,493 | 2,683 | 2,812 | 2,939 | 3,122 | 3,331 | 3,560 | 3,814 |
| Vietnam | 3,549 | 3,757 | 4,133 | 4,317 | 4,536 | 4,745 | 4,965 | 5,262 | 5,600 | 5,952 | 6,324 |
| Thailand | 7,170 | 7,236 | 7,073 | 7,351 | 7,493 | 7,942 | 7,979 | 8,248 | 8,566 | 8,917 | 9,291 |
| Myanmar | 1,433 | 1,022 | 1,240 | 1,140 | 1,122 | 1,097 | 1,176 | 1,278 | 1,377 | 1,476 | 1,498 |
| Laos | 2,529 | 2,496 | 2,022 | 1,980 | 2,070 | 2,174 | 2,254 | 2,330 | 2,408 | 2,492 | 2,579 |
| The Mekong Region | 3,992 | 4,003 | 4,143 | 4,279 | 4,415 | 4,626 | 4,749 | 4,977 | 5,235 | 5,511 | 5,786 |
Source: International Monetary Fund (IMF), October 2025
Note: Estimated 2025 – 2030
- The income levels of residents in the Mekong Region have improved tremendously with a 15-year (2009-2024) CAGR of 5.2% to US$4,415 GDP per capita in 2024 from as low as US$2,061 GDP per capita in 2009.
- Cambodia especially has demonstrated rising income levels during this period, tripling its GDP per capita from US$913 in 2009 to US$2,683 in 2024. This represents a 15-year (2009-2024) CAGR of 7.5%.
- According to the IMF, income levels of residents in the Mekong Region will continue to increase to US$5,786 GDP per capita by 2030 with a 5-year (2025-2030) CAGR of 4.6%, with Cambodian income levels set to increase to US$3,814 GDP per capita by 2030 with a 5-year (2025-2030) CAGR of 6.3%.
- The steady rise in income will benefit NagaWorld by boosting travel and increasing visitor’s numbers to Cambodia and to NagaWorld.

Source: International Monetary Fund (IMF), October 2025
Note: Estimated 2025 – 2030
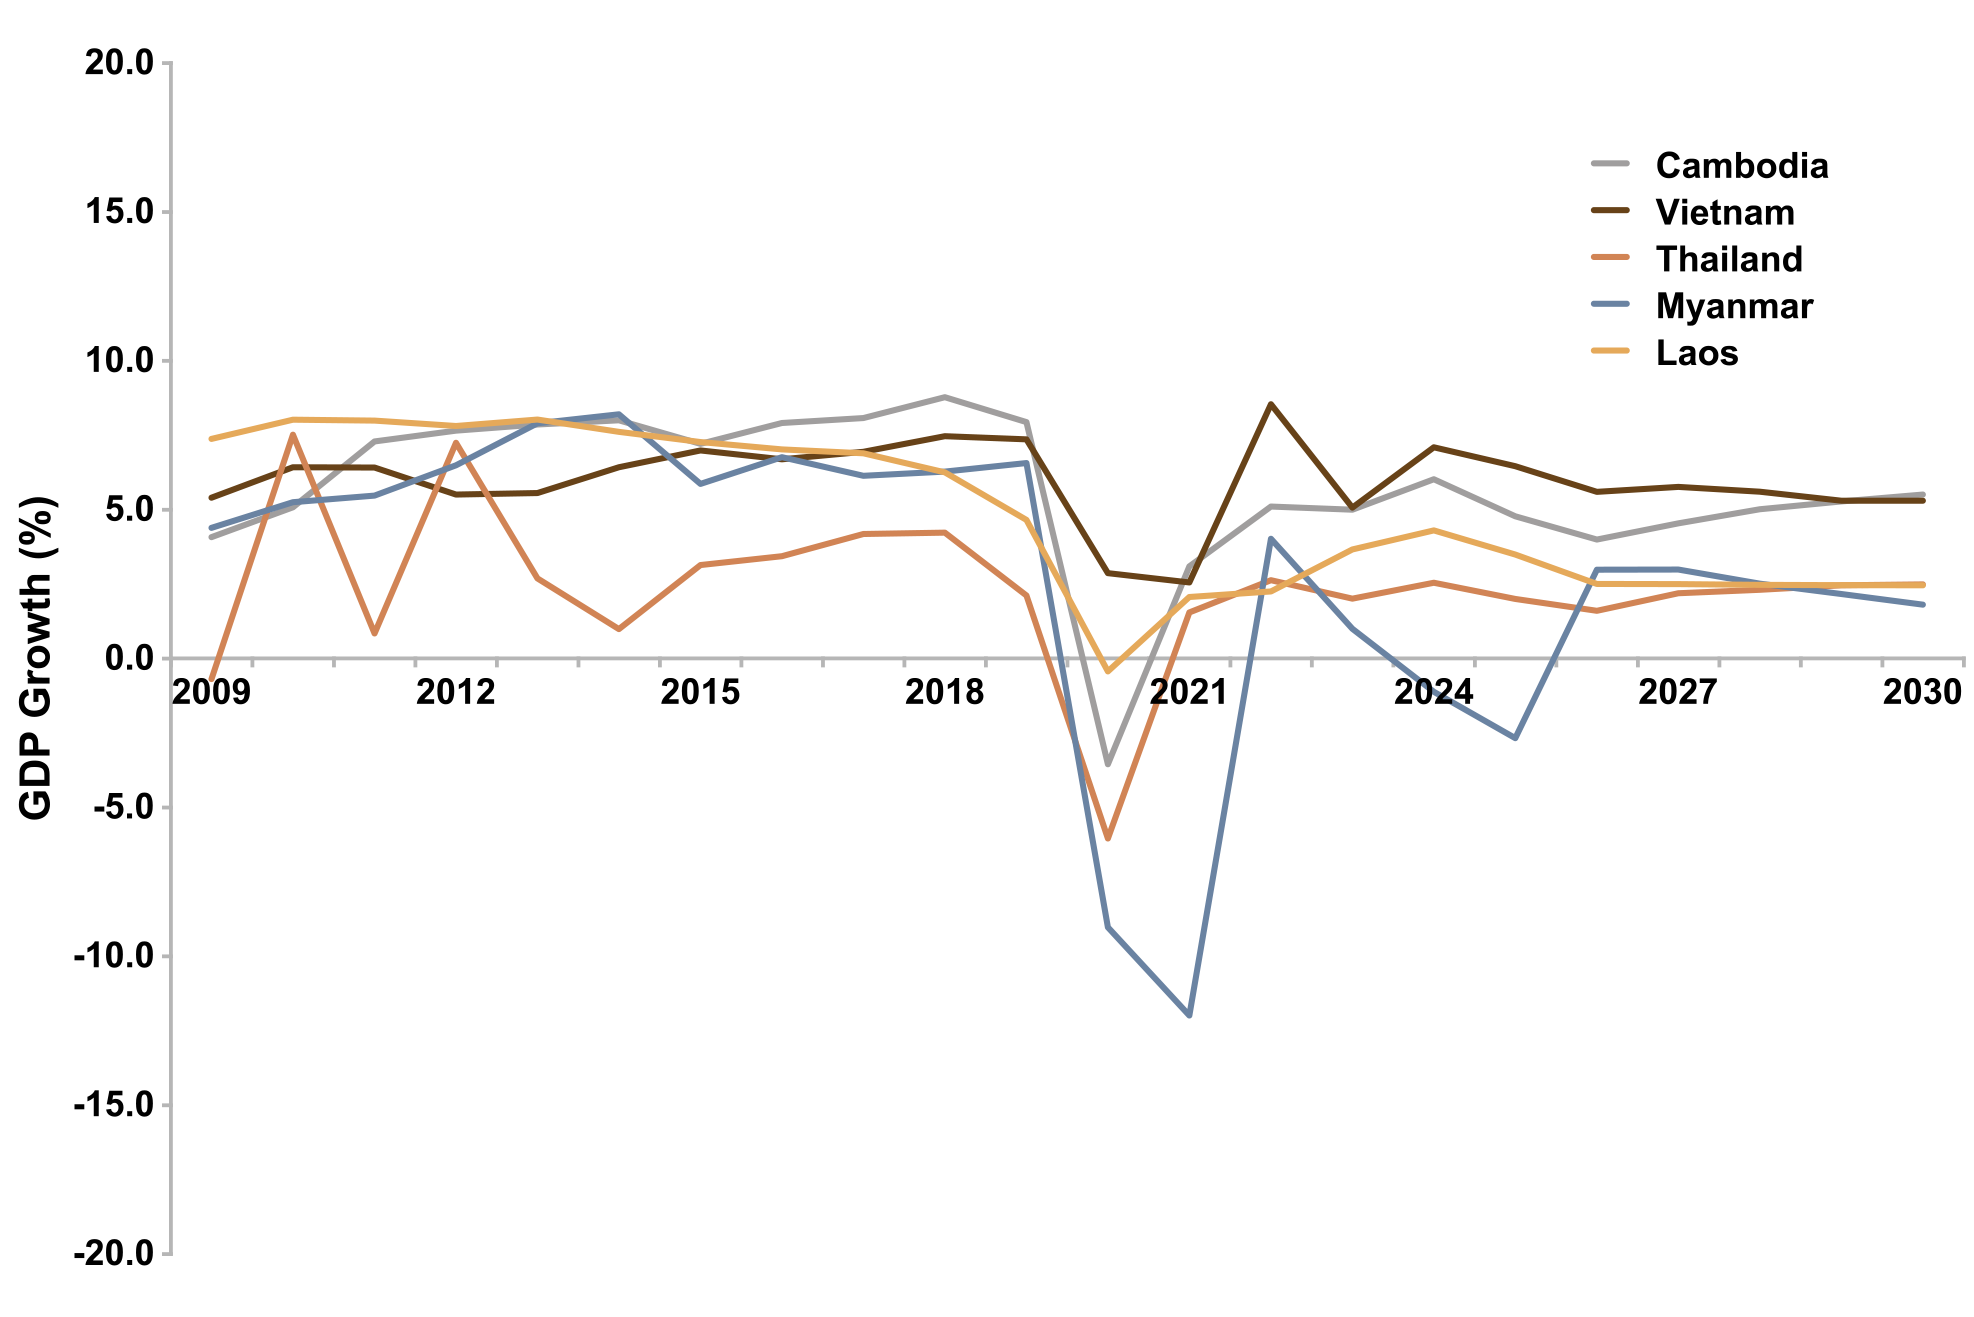
- GDP growth of the five countries in the Mekong Region has been strong over the past decade. Despite the uncertainty in the global economic environment, the IMF has projected GDP growth in Cambodia to growth at 4.8% and 4.0% in 2025 and 2026 respectively.
- Cambodia has registered a GDP growth of 6.0% on average over the past 15 years (2009-2024), and the IMF projects that the country will grow at an average annual growth rate of 4.8% between 2025 and 2030.

Source: International Monetary Fund (IMF), October 2025
Note: Estimated 2025 – 2030
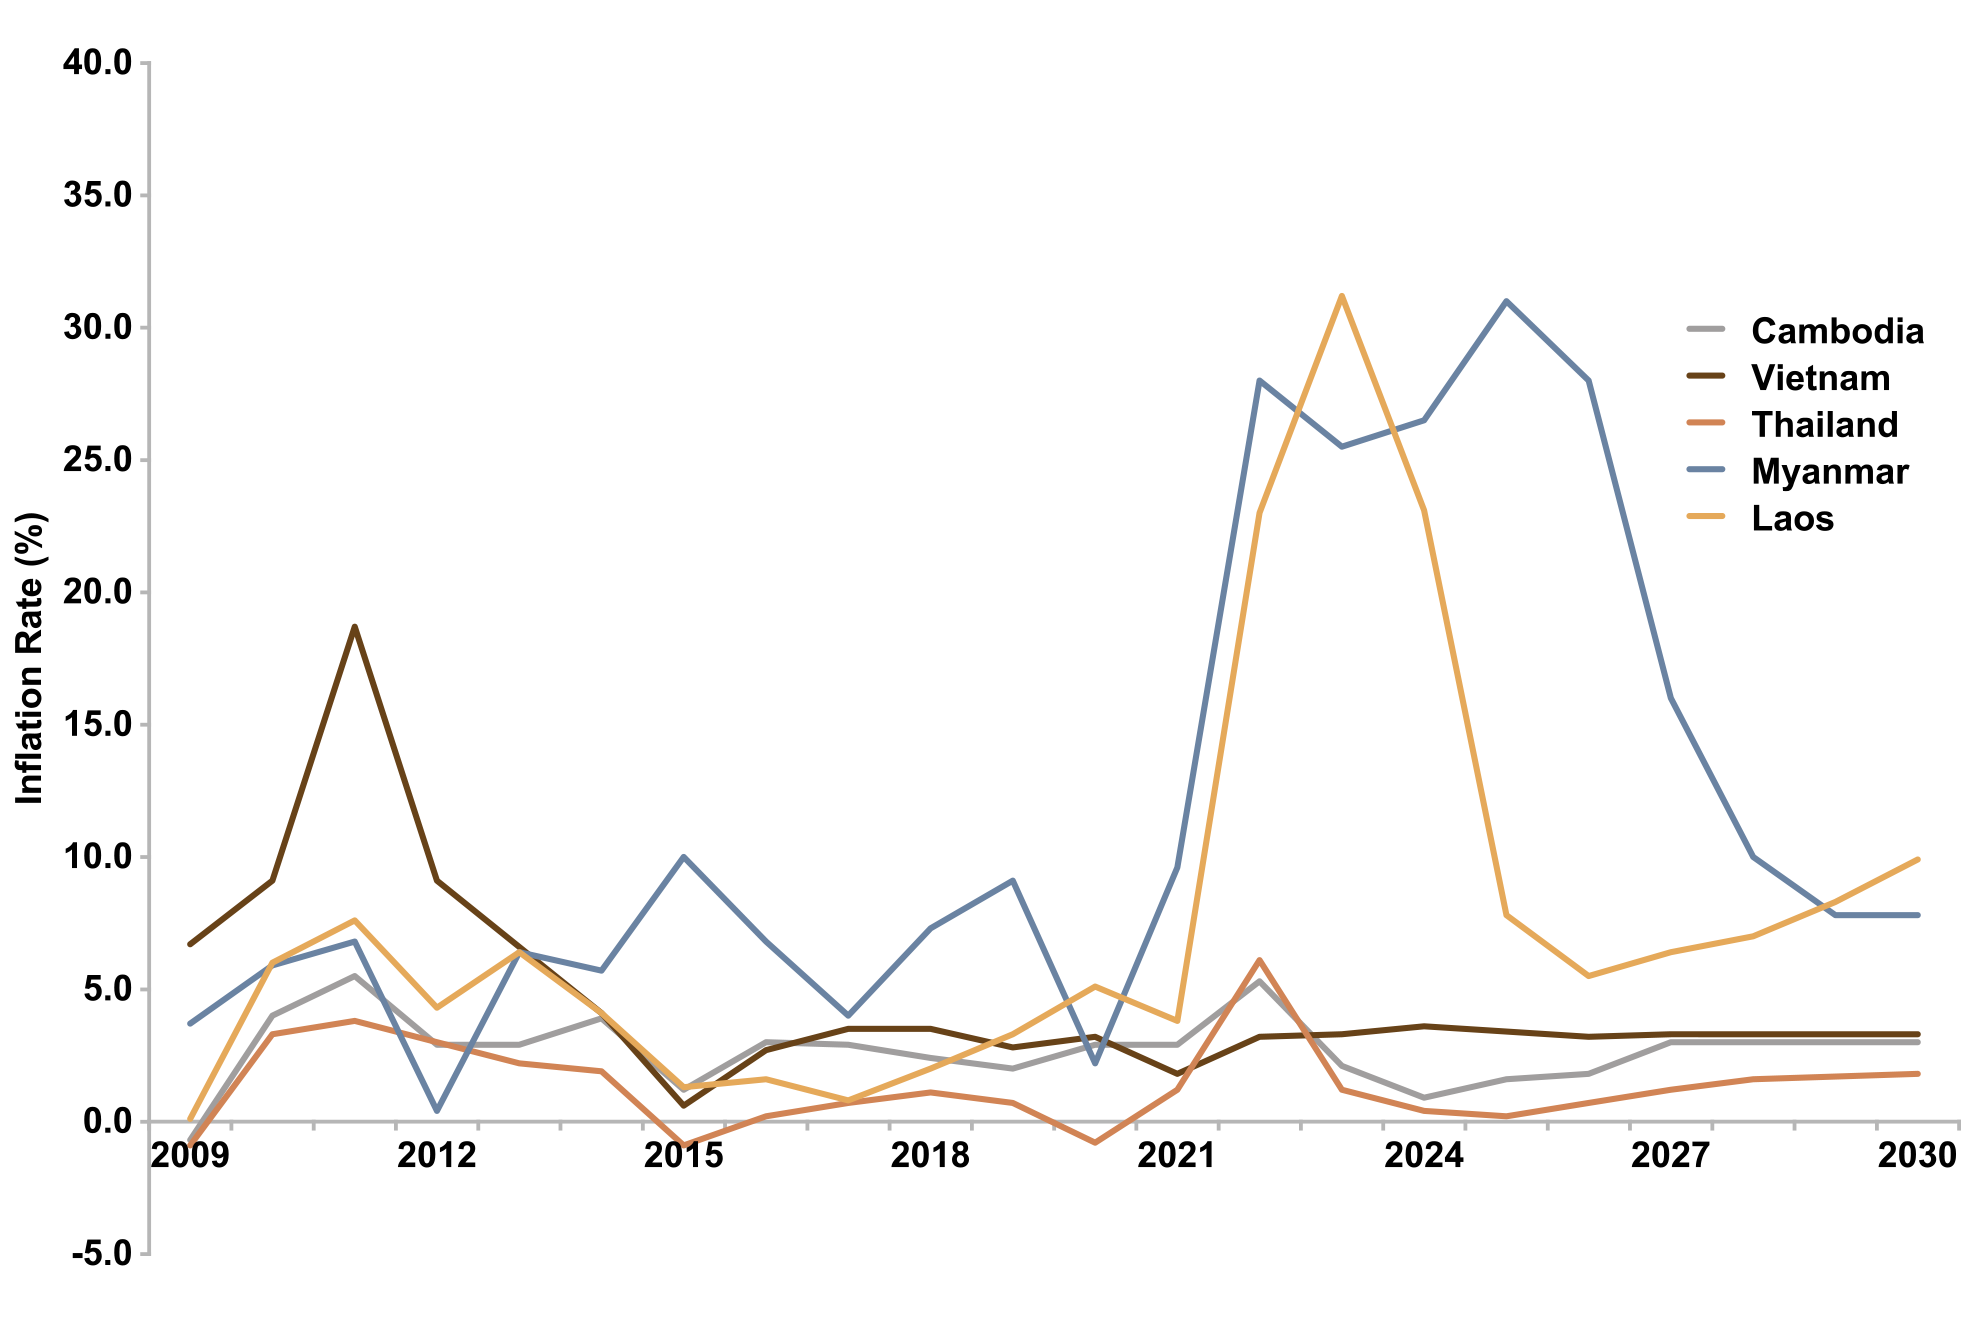
- The inflation rate in the Mekong Region has been quite volatile over the past decade. The IMF expects inflation pressures in most of the region remain relatively stable for all five countries within the Mekong Region.
- Cambodia has registered a manageable average inflation rate of 2.8% over the past 15 years (2009-2024), and the IMF expects its inflation rate remains at an average rate of 2.6% from 2025 to 2030.
| FDI (US$ million) |
2013 | 2014 | 2015 | 2016 | 2017 | 2018 | 2019 | 2020 | 2021 | 2022 | 2023 | 2024 |
| Cambodia | 1,275 | 1,727 | 1,701 | 2,476 | 2,788 | 3,213 | 3,663 | 3,625 | 3,483 | 3,579 | 3,959 | 4,395 |
| Vietnam | 8,900 | 9,200 | 11,800 | 12,600 | 14,100 | 15,500 | 16,120 | 15,800 | 15,660 | 17,900 | 18,500 | 20,170 |
| Thailand | 15,493 | 4,809 | 5,624 | 2,491 | 7,875 | 11,705 | 3,781 | (5,630) | 14,648 | 11,705 | 8,053 | 10,580 |
| Myanmar | 2,621 | 946 | 2,824 | 2,989 | 4,002 | 1,610 | 1,730 | 2,206 | 1,005 | 2,981 | 2,204 | 1,849 |
| Laos | 427 | 913 | 1,079 | 1,076 | 1,695 | 1,358 | 756 | 968 | 1,072 | 636 | 1,781 | 988 |
| The Mekong Region |
28,715 | 17,595 | 23,028 | 21,632 | 30,461 | 33,386 | 26,049 | 16,968 | 35,868 | 36,801 | 34,497 | 37,982 |
Source: Association of Southeast Asian Nations, August 2025
- The Mekong Region has been able to attract a sizeable amount of FDI into the region totalled US$38.0 billion in 2024. Cambodia is ranked third after Vietnam and Thailand.
- FDIs into Cambodia increased by 155% from US$1.7 billion in 2014 to US$4.4 billion in 2024, representing a CAGR of 9.8%.
- The Cambodian Government has been proactive in attracting FDIs and the increase in FDIs will create more job opportunities and increase the overall income level of the country. In 2024, China accounted for 68.9% of total FDI in Cambodia, followed by Canada (8.6%), Singapore (6.9%), South Korea (5.6%), Japan (4.2%), Malaysia (2.3%), and Others (3.6%) (Source: Financial Stability Review 2024, National Bank of Cambodia).


