
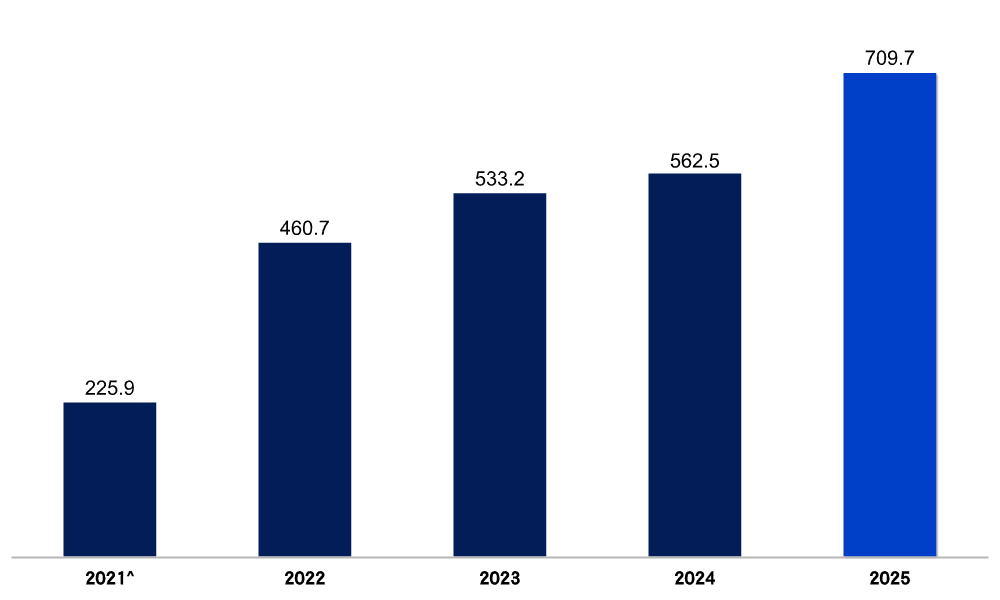
Revenue (US$ million)
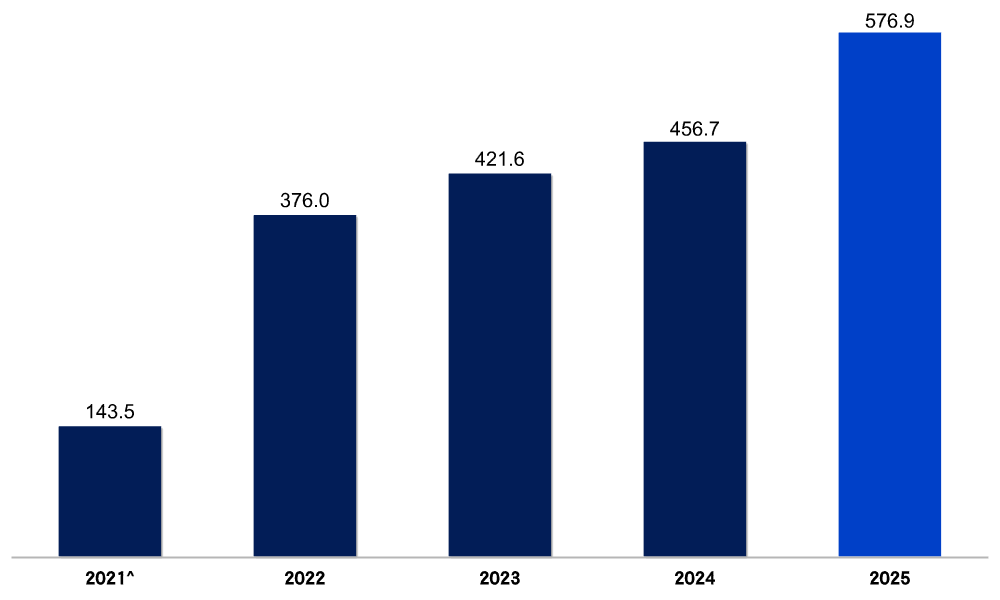
Gross Profit (US$ million)
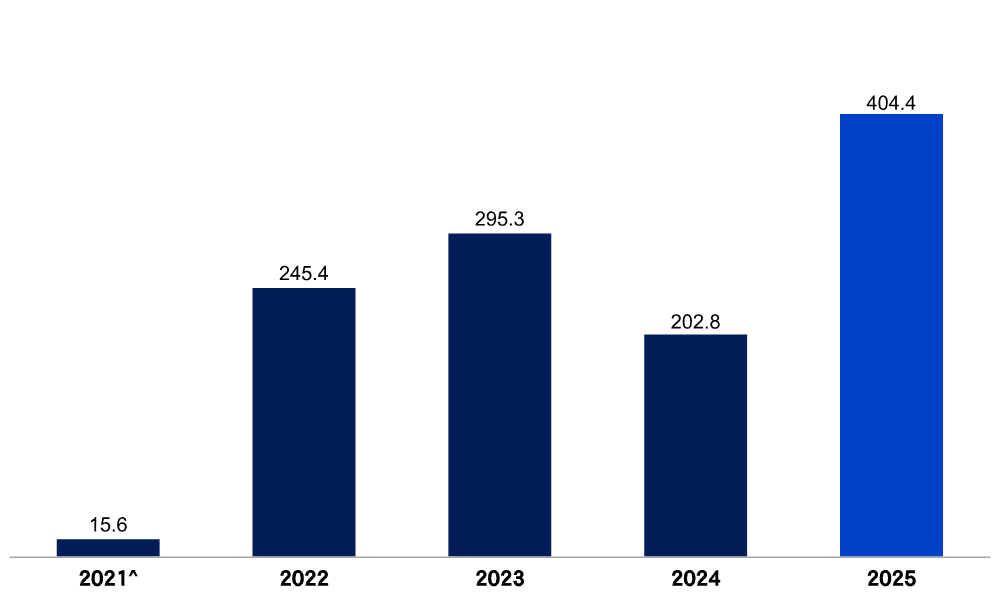
EBITDA (US$ million)
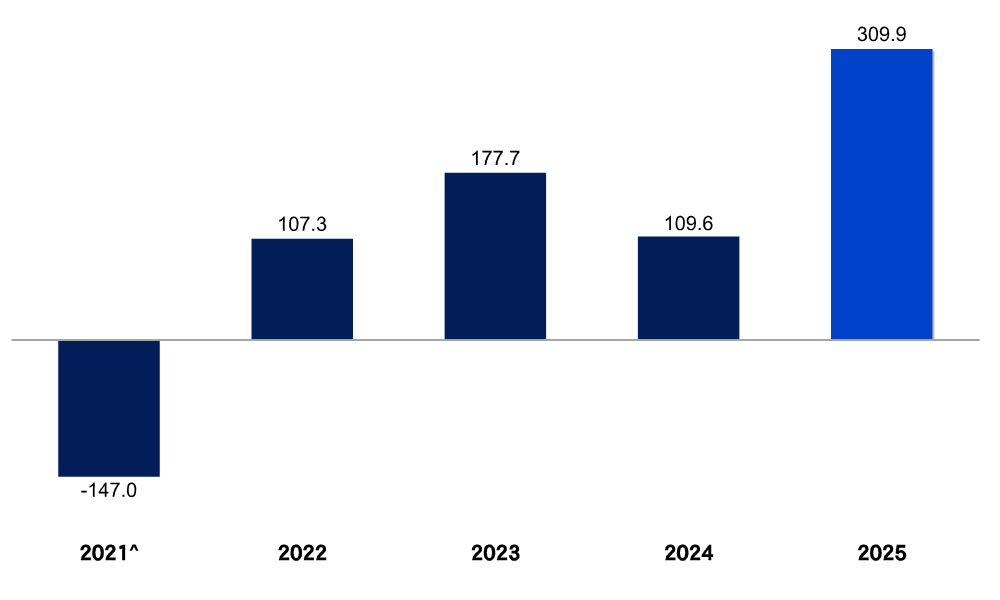
Net Profit/(Loss) (US$ million)
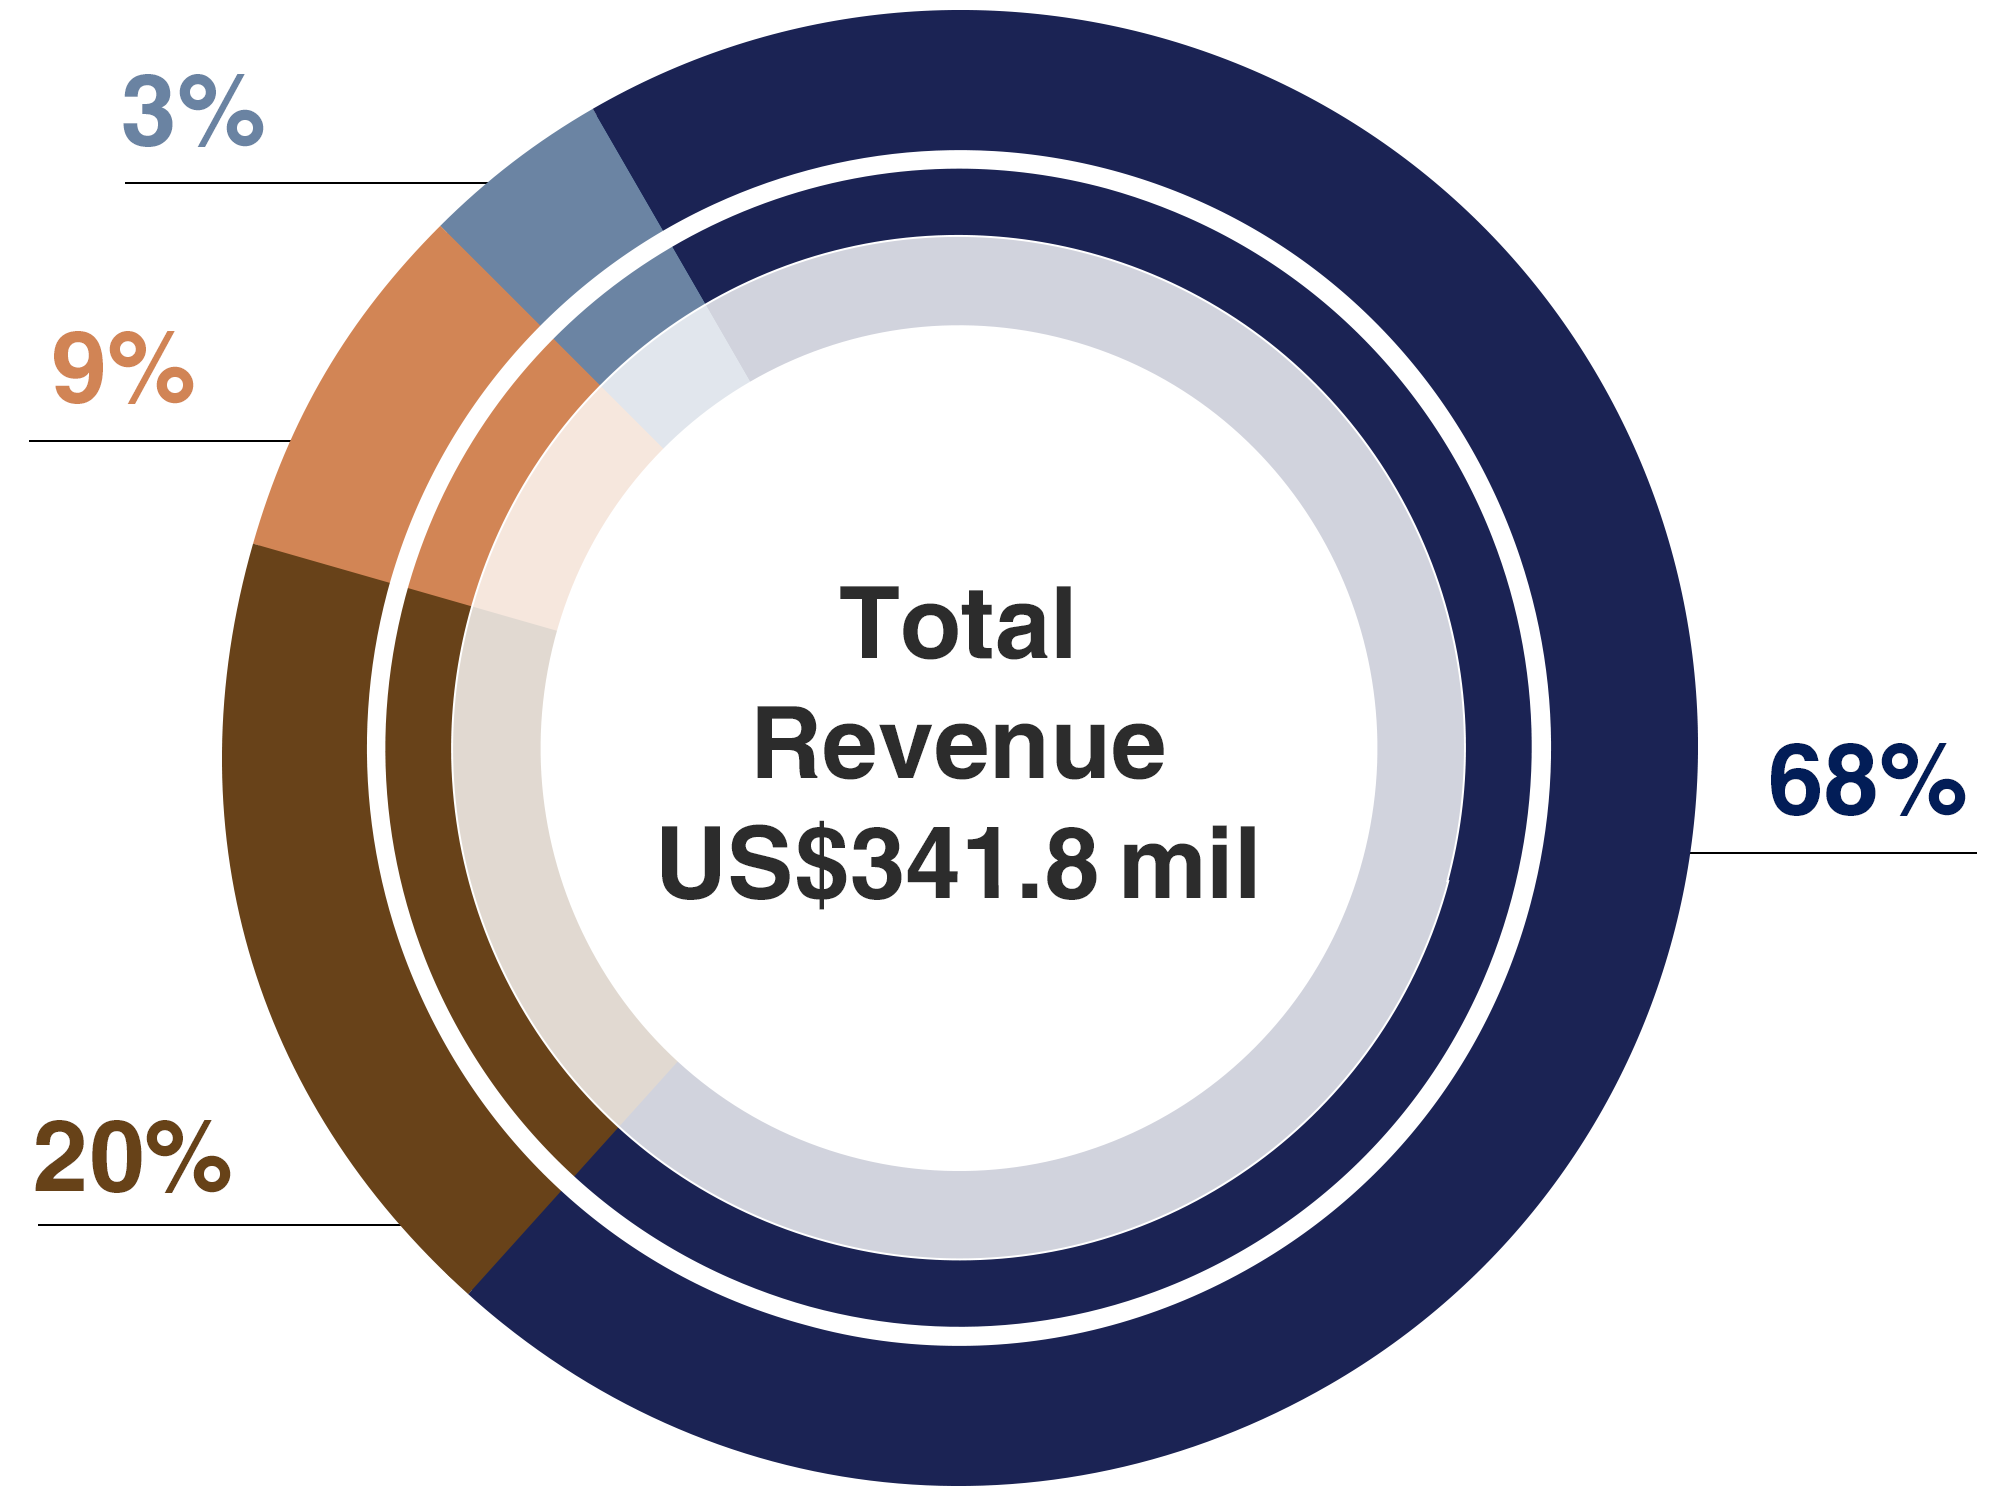
Revenue Composition
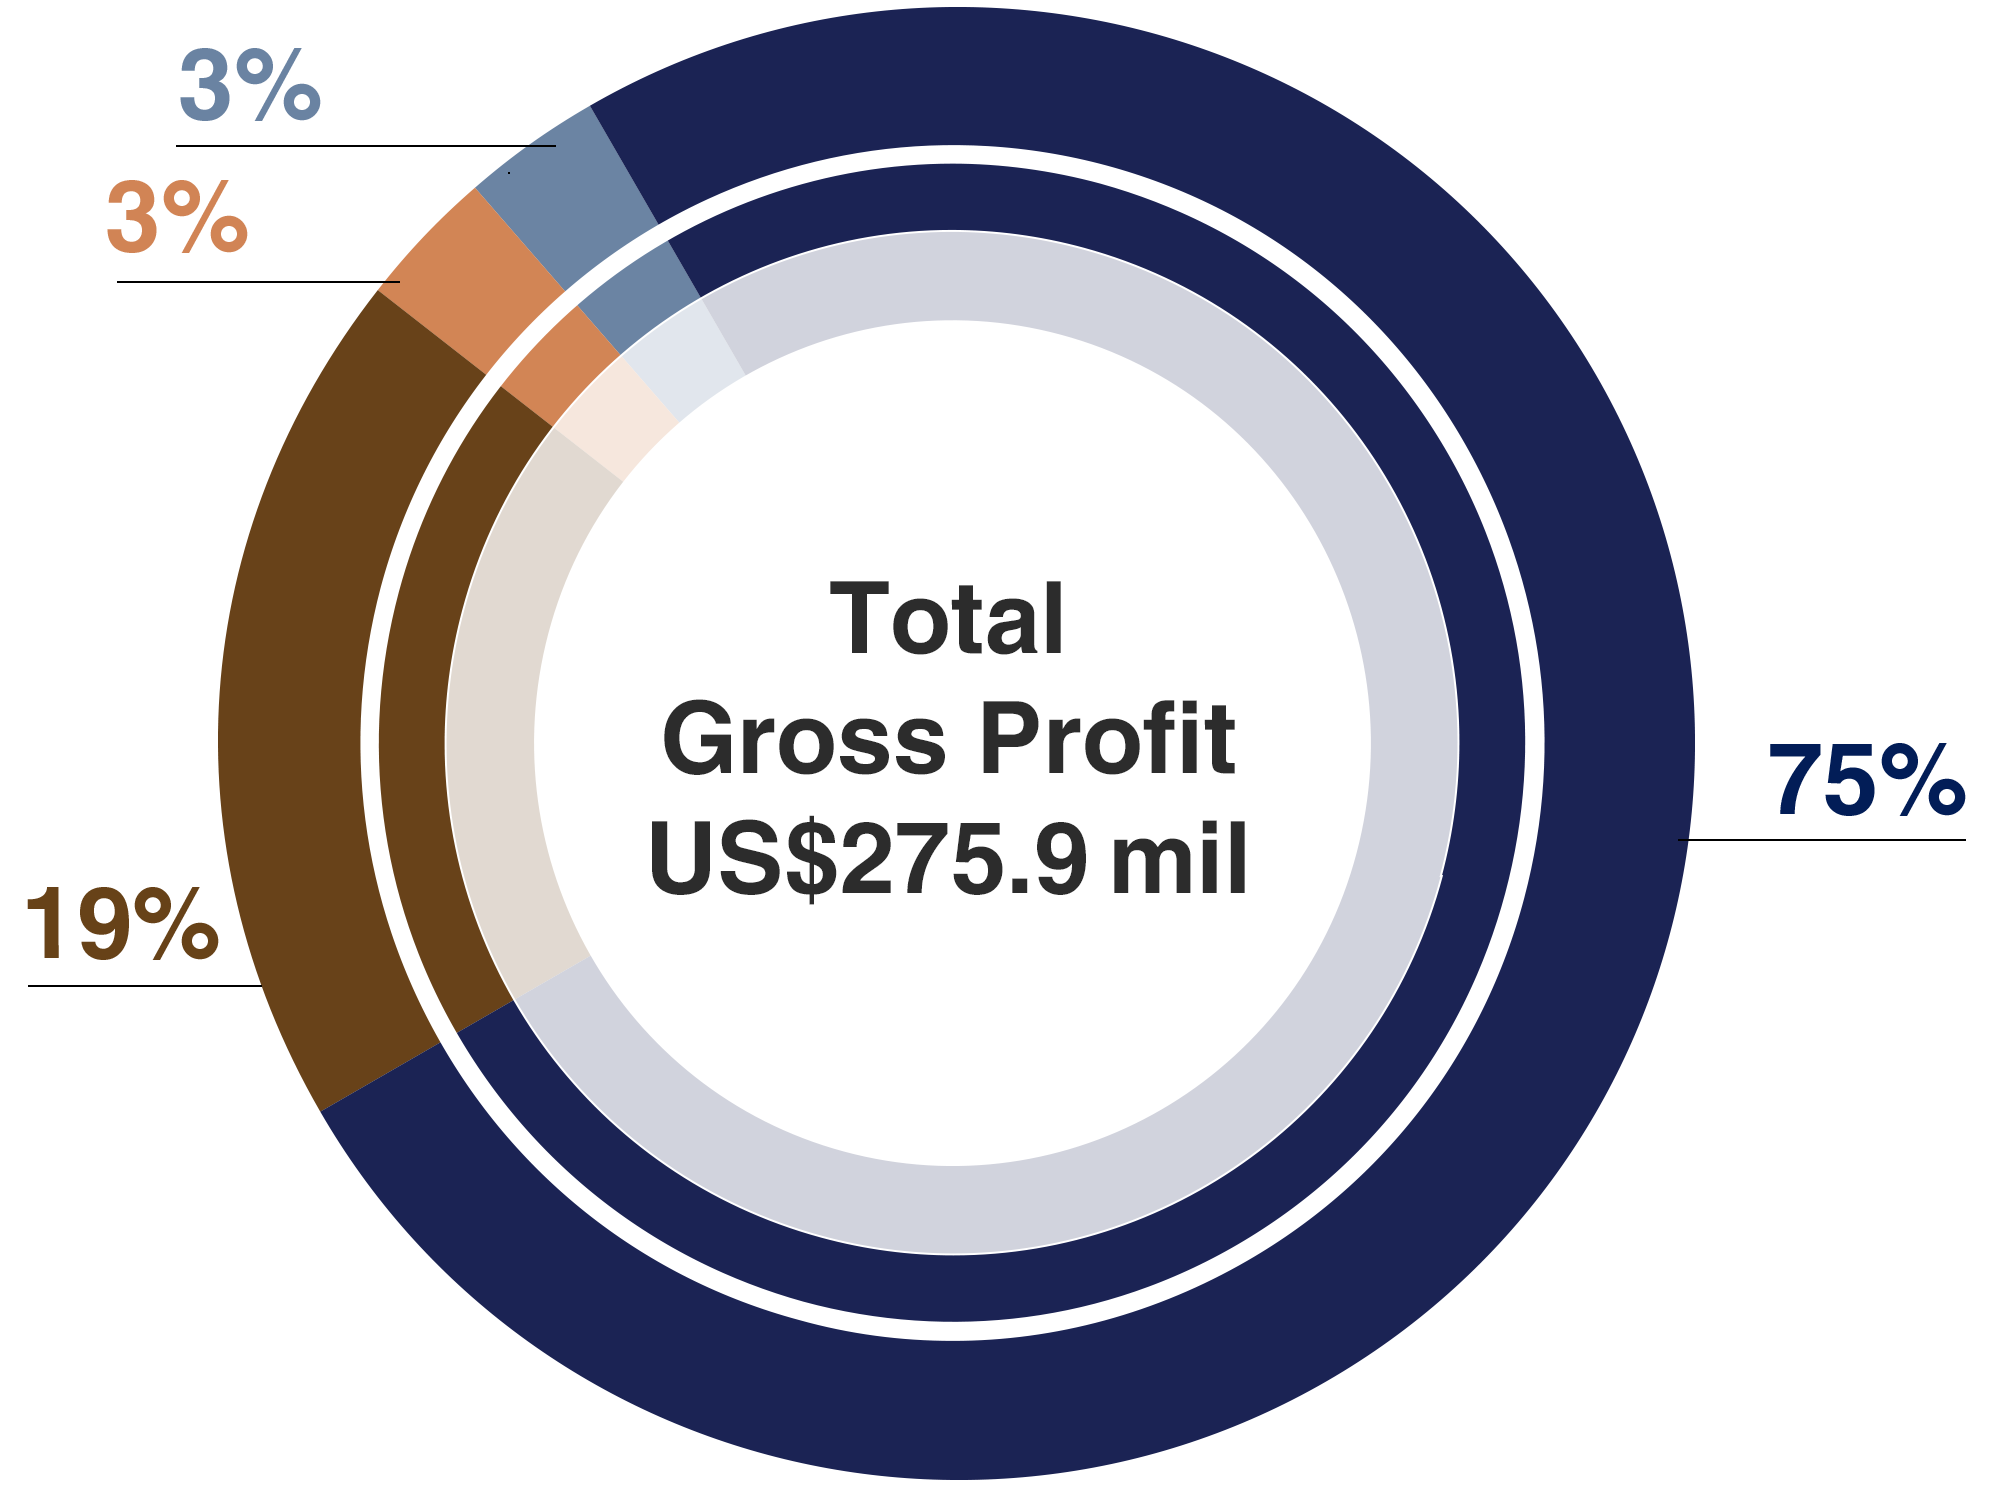
Gross Profit Composition

2025
- Gross Gaming Revenue of US$691.6 million
- EBITDA of US$404.4 million
- Basic earnings per share of US cents 7.01
Revenue and Gross Profit Analysis
| FY2025 | Revenue | Gross Profit | Gross Profit Margin |
||
| US$ million | % | US$ million | % | % | |
|---|---|---|---|---|---|
| Mass Market | 485.0 | 68 | 435.9 | 76 | 90 |
| Premium VIP Market | 136.2 | 19 | 109.5 | 19 | 80 |
| Referral VIP Market | 70.4 | 10 | 16.3 | 3 | 16 |
| Non-Gaming | 18.1 | 3 | 15.2 | 2 | 84 |
| Total | 709.7 | 100 | 576.9 | 100 | 81 |
^5.5 months of business operations due to the voluntary temporary suspension of business operations between 2 March and 14 September in response to the COVID-19 situation in Cambodia.